Bollinger Bands provide a statistical boundary around a stock’s price. Investors use Bollinger Bands with other indicators to assist in predicting price movements.
With amazing accuracy, statistics deal with determining the likelihood (or possibility) of something occurring. This likelihood is also referred to as the probability. When recording data such as stock prices, peoples height, error in factory measurements, student test scores, etc. this data fits inside of a statistical enveloped called a bell curve. Actually the technical name for the bell curve is “a normal distribution”. This bell curve typically reflects the data grouped into 6 sections along with the average of the data.
When stock price data gets averaged, and statistics applied, a number is produced. This number (called the standard deviation) can be plotted (+) above and (-) below the average price and represents 2 sections of the bell curve. Said another way, a plot of the 2 sections are +/-1 standard deviation.
Shown as percentages:
- 68% of those stock prices fall within +/- 1 standard deviation from the stock price average
- 95% of those stock prices fall within +/- 2 standard deviation from the stock price average
- 99.7% of those stock prices fall within +/- 3 standard deviation from the stock price average
For the stock price “average”, Bollinger Bands use a 20 Day Moving Average (DMA). And the upper and lower Bollinger Band envelopes engulf that 20 DMA line by +/- 2 standard deviations. That is, lines are drawn 2 standard deviations above, and 2 standard deviations below the 20 DMA line. Therefore, 95% of the price movement has a high likelihood of staying within the boundaries of the Bollinger Band envelopes.
When a stock’s price is relatively stable, the average price tends to be smooth and therefore the Bollinger Band characterizes smoothness in its boundaries. However, when a stock’s price becomes volatile and starts continuously moving in an all negative or all positive direction, so does the 20 DMA. This results in an expanding Bollinger Band boundary above and below that 20 DMA. Bollinger Bands Figure 1 displays the grey envelope surrounding price movement of the Dow Jones Industrial Average.
For more information on moving averages refer to Moving Averages.
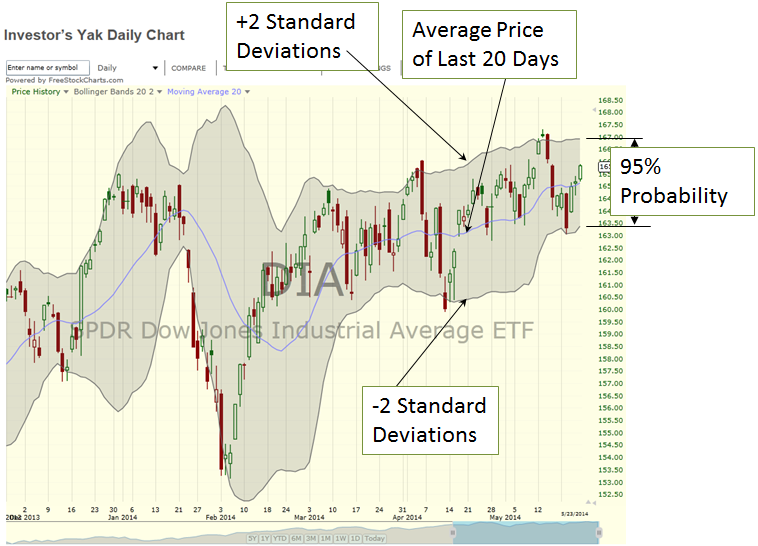
Bollinger Bands Figure 1