The 1st Action Zone technical analysis indicator is the stochastic oscillator. Stochastic Indicators oscillate between an upper Overbought line and lower Oversold line. These indicators provide some of the earliest alerts of a potential price movement. They are considered Leading Indicators because they lead in providing an action signal before many other types of indicators. Lagging Indicators don’t provide their trigger signal until later, after a price move has begun.
An upper limit boundary line is drawn at the stochastic 80% point. The 80% line and above is referred to as the overbought region. Frequently this is where the price of a stock tends to begin tapering off. Sometimes the tapering off is temporary prior to continued buying (e.g. when a stock is in an uptrend). Other times, when a stocks price is in a sideways trading range, the price falls after tapering off.
Similarly an oversold lower limit boundary is drawn at the stochastic 20% point. Falling stock prices tend to temporarily slow down when the stochastic indicators is near this 20% point. Following this slow down, prices either bounce back up (in a trading range), or continue downward in a downtrend. Visual representations of these overbought and oversold lines are illustrated in Stochastic Oscillator Figure 1.
The actual indicator used as the Stochastic Oscillator signal is composed of 2 graphs called the %K and %D. In very simple terms, the %D is a moving average and the %K is a unique math formula of a stock’s price during a specified period. Plotted together they are seen alongside of one another. Eventually these 2 line reverse direction and do a U-turn. It is at this U-turn the 2 lines cross over each other and “signal” a potential change in a stock’s price. Sometimes the price hesitates or stalls before continuing in the same direction it was going in. Other times the price changes direction and makes significant moves. In either case, the indicator swings (or oscillates) above and below the overbought/oversold boundaries. When below the 20% boundary, if the 2 lines cross each other, it signals a potential upward price move. Using this signal as a trigger and combining it with a MACD momentum signal can help in the Action Zone stock selection process.
See Leading and Lagging Indicators and Overbought versus Oversold Indicators for more information.
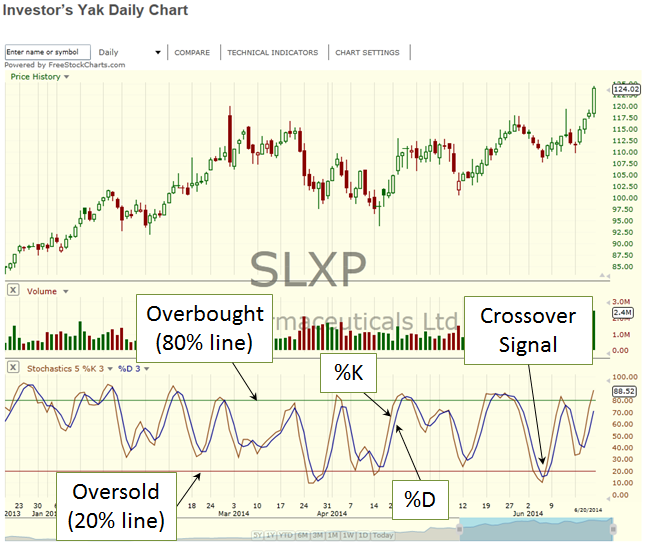
Stochastic Oscillator Figure 1