Volume represents the total quantity of all shares bought and sold for a particular stock during the day. These are all the transactions for every share that have occurred. Ideally, if more buyers are actively demanding a purchase then the price per share should increase (see Volume Figure 1). Conversely, when more sellers are dumping or selling a stock, the price tends to fall (see Volume Figure 2). Graphically, the volume shown under a stock’s price increases as the day continues. During high levels of buying and selling, the volume will increase higher than the prior day and possibly more than average. On a daily chart, several days of this rising volume will appear as a positive upward slope.
There are often times in which financial institution accumulate extremely large quantities of a company’s stock. During these abnormally high levels of buying and selling, the volume increase will spike to some of the highest magnitudes on a chart. Weekly chart volume offers another perspective on the magnitude of buying and selling that has occurred. It is like zooming out and getting a bigger picture of a stock’s action.
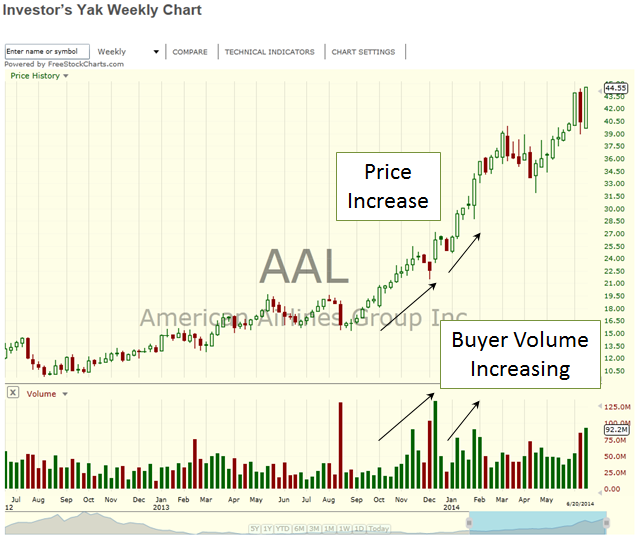
Volume Figure 1
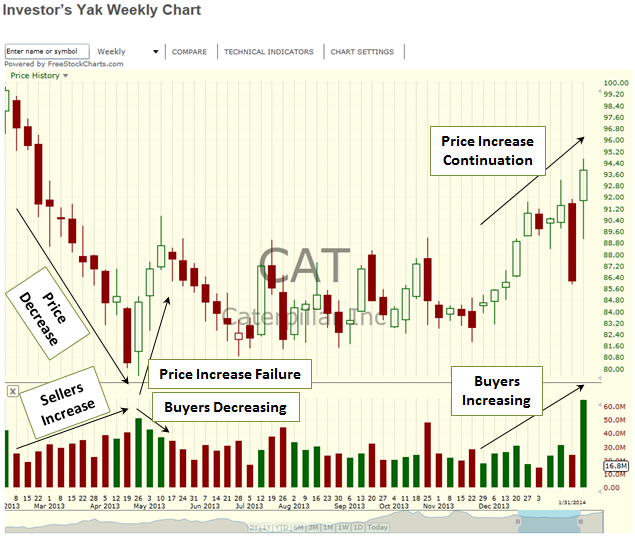 Volume Figure 2