The 2nd Action Zone technical analysis indicator is the MACD. The MACD illustrates Momentum in the form of an oscillation above and below a reference line of zero. Positive momentum indicates increasing price strength while negative momentum indicates decreasing price strength. Combining this MACD indication of momentum with the other Action Zone indicators assists in the stock selection process.
MACD plots are determined using math distinctive to momentum. Newer price data is subtracted from older price data which results in a feel for the direction of possible stock price movement. Increasing price strength of newer data suggests buyer demand is beginning to increase in contrast to the prior demands. Conversely, decreasing price strength suggests poor buyer demand (or increase in selling).
Newer price data is based on the last twelve (12) days and is a 12 day moving average (DMA). Older price data is a 26 DMA and therefore represent prices further back in history. The MACD plot equals (12 DMA – 26 DMA). A 9 DMA is overlaid on top of the MACD plot to help confirm momentum in one direction or the other. When the MACD plot crosses the 9 DMA it signals the possibility of continued price momentum in the present direction. MACD Figure 1 graphically illustrates the Moving Average Convergence/Divergence indicator.
For more information on moving averages refer to Moving Averages.
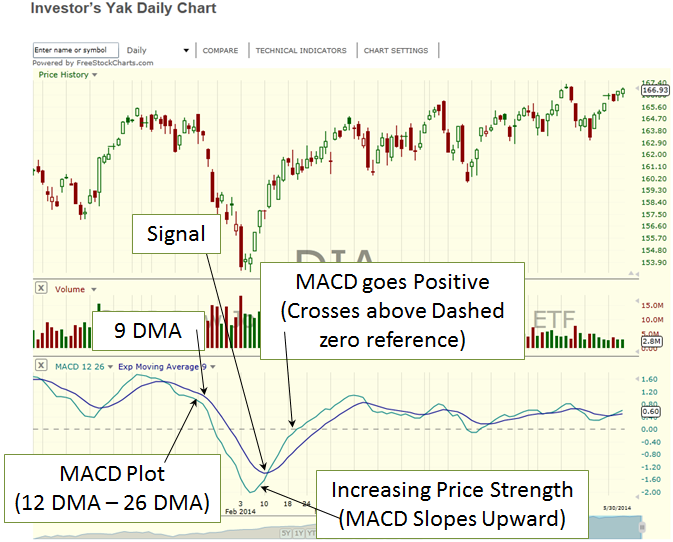
MACD Figure 1