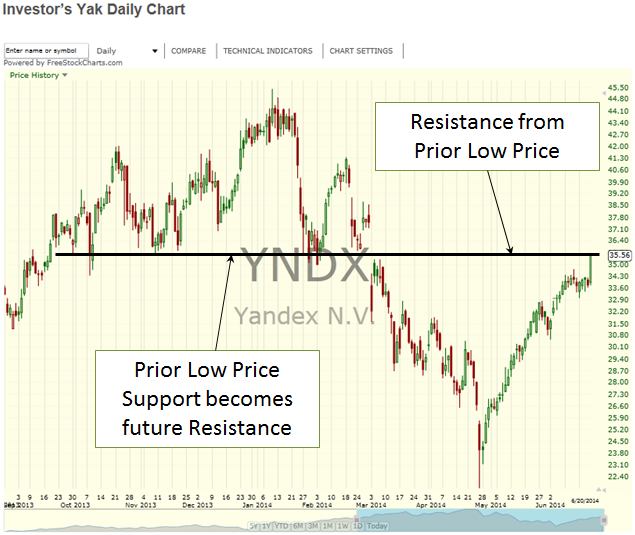
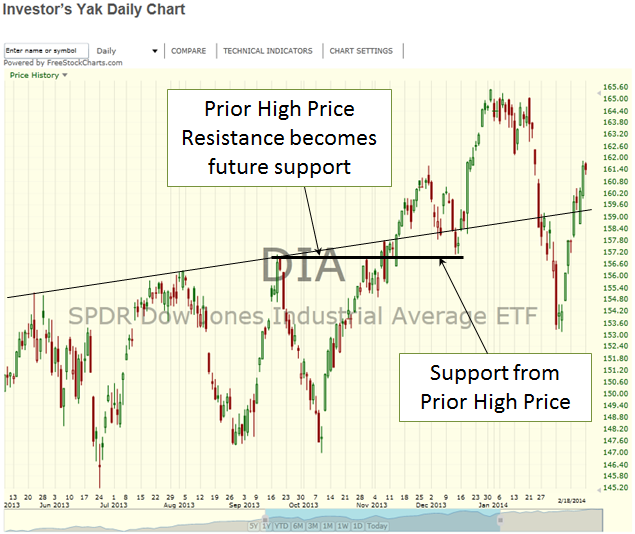
Support and resistance have a rather surprising interaction. To better appreciate this interaction, an independent review of support and resistance is recommended. Many times after a stock breaks above resistance, it continues upward in price until buyers finally give up on purchase opportunities. Eventually, sellers become the majority in the market and a stock’s price begins to pullback. Amazingly, the pullback stabilizes and frequently comes to rest at the place of prior resistance. That resistance, now manifesting itself as support, exhibits a point of equilibrium between buyers and sellers. Thus the saying “what was once resistance turns into support” becomes a surprising truth. Support & Resistance Figure 1 and 2 provide visual insight on price movement between support and resistance.
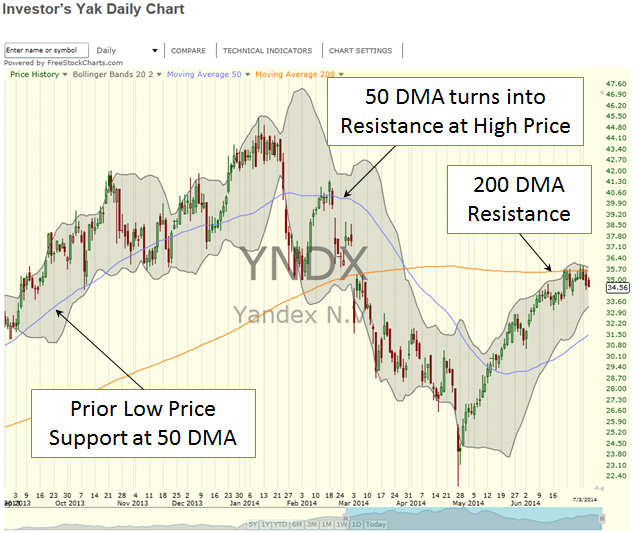
If the market has been in an uptrend, eventually a price pullback will occur. The pullback may result in prices settling down at prior high prices support areas or maybe even a predominant moving average. This new level of support is an area to watch closely. Stock prices frequently bounce off support and when other technical indicators are signaling correctly, a buy opportunity may be near. Support & Resistance Figure 3 includes the 50 and 200 day moving averages as well as Bollinger Bands to show price limits affecting Yandex (YNDX).
When the market has been in a downtrend, a pullback to support could result in nothing more than a slight bounce followed by even greater price declines. Many investors watch for downtrends to settle out and reverse direction when support is achieved.
For more insight see moving averages, trends, Bollinger Bands, support, and resistance.
Support & Resistance Figure 1
 Support & Resistance Figure 2
Support & Resistance Figure 3

