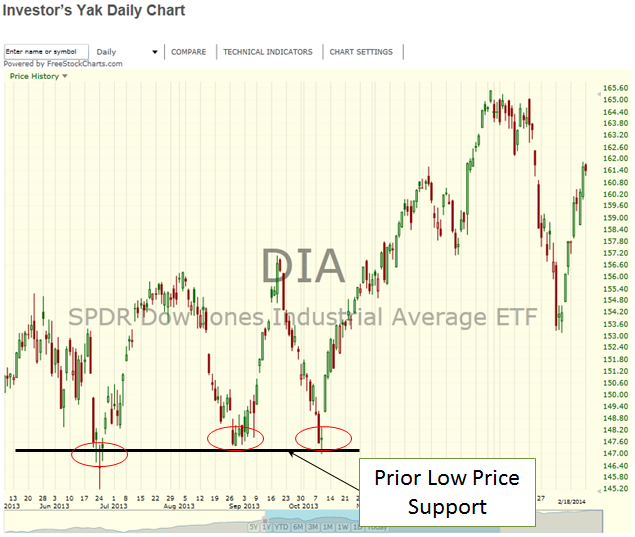
When stock prices decline or pull back (PB), they eventually come to rest at an area of supply/demand support. Interestingly, stock charts show support occurs at a number of different places. Many times the price is supported close to prior high prices. Other times the support is found near a stock’s price moving average. Support can also be recognized around a trend line, Bollinger band envelope line, Fibonacci level, prior low price, or other technical analysis graph. Price support is provided graphically in Support Figure 1.
Understanding where potential price support is located on a stock’s chart can help in planning a target entry price and contribute to risk/reward analysis. It is also essential to realize the concept of resistance which represents an opposing effect to support.
Support Figure 1